10+ Free Interactive Bar Graph Worksheets 3rd Grade
Buy 2700+ Pages Math Games & Activities (PreK-2nd Grade)
These free interactive bar graph worksheets for the 3rd grade will help the students develop a basic idea of bar graphs and also improve their visual sense of reading graphs. You may get an idea from these line graph activities before starting the discussion.
10 Interactive Bar Graph Worksheets for 3rd Grade
Here, we have inserted 11 interactive bar graph worksheets for 3rd grade. Students above 3rd grade can also practice the worksheets and increase their skills in the sector of graphs. These bar graphs will help you to expertise in data analysis skills.
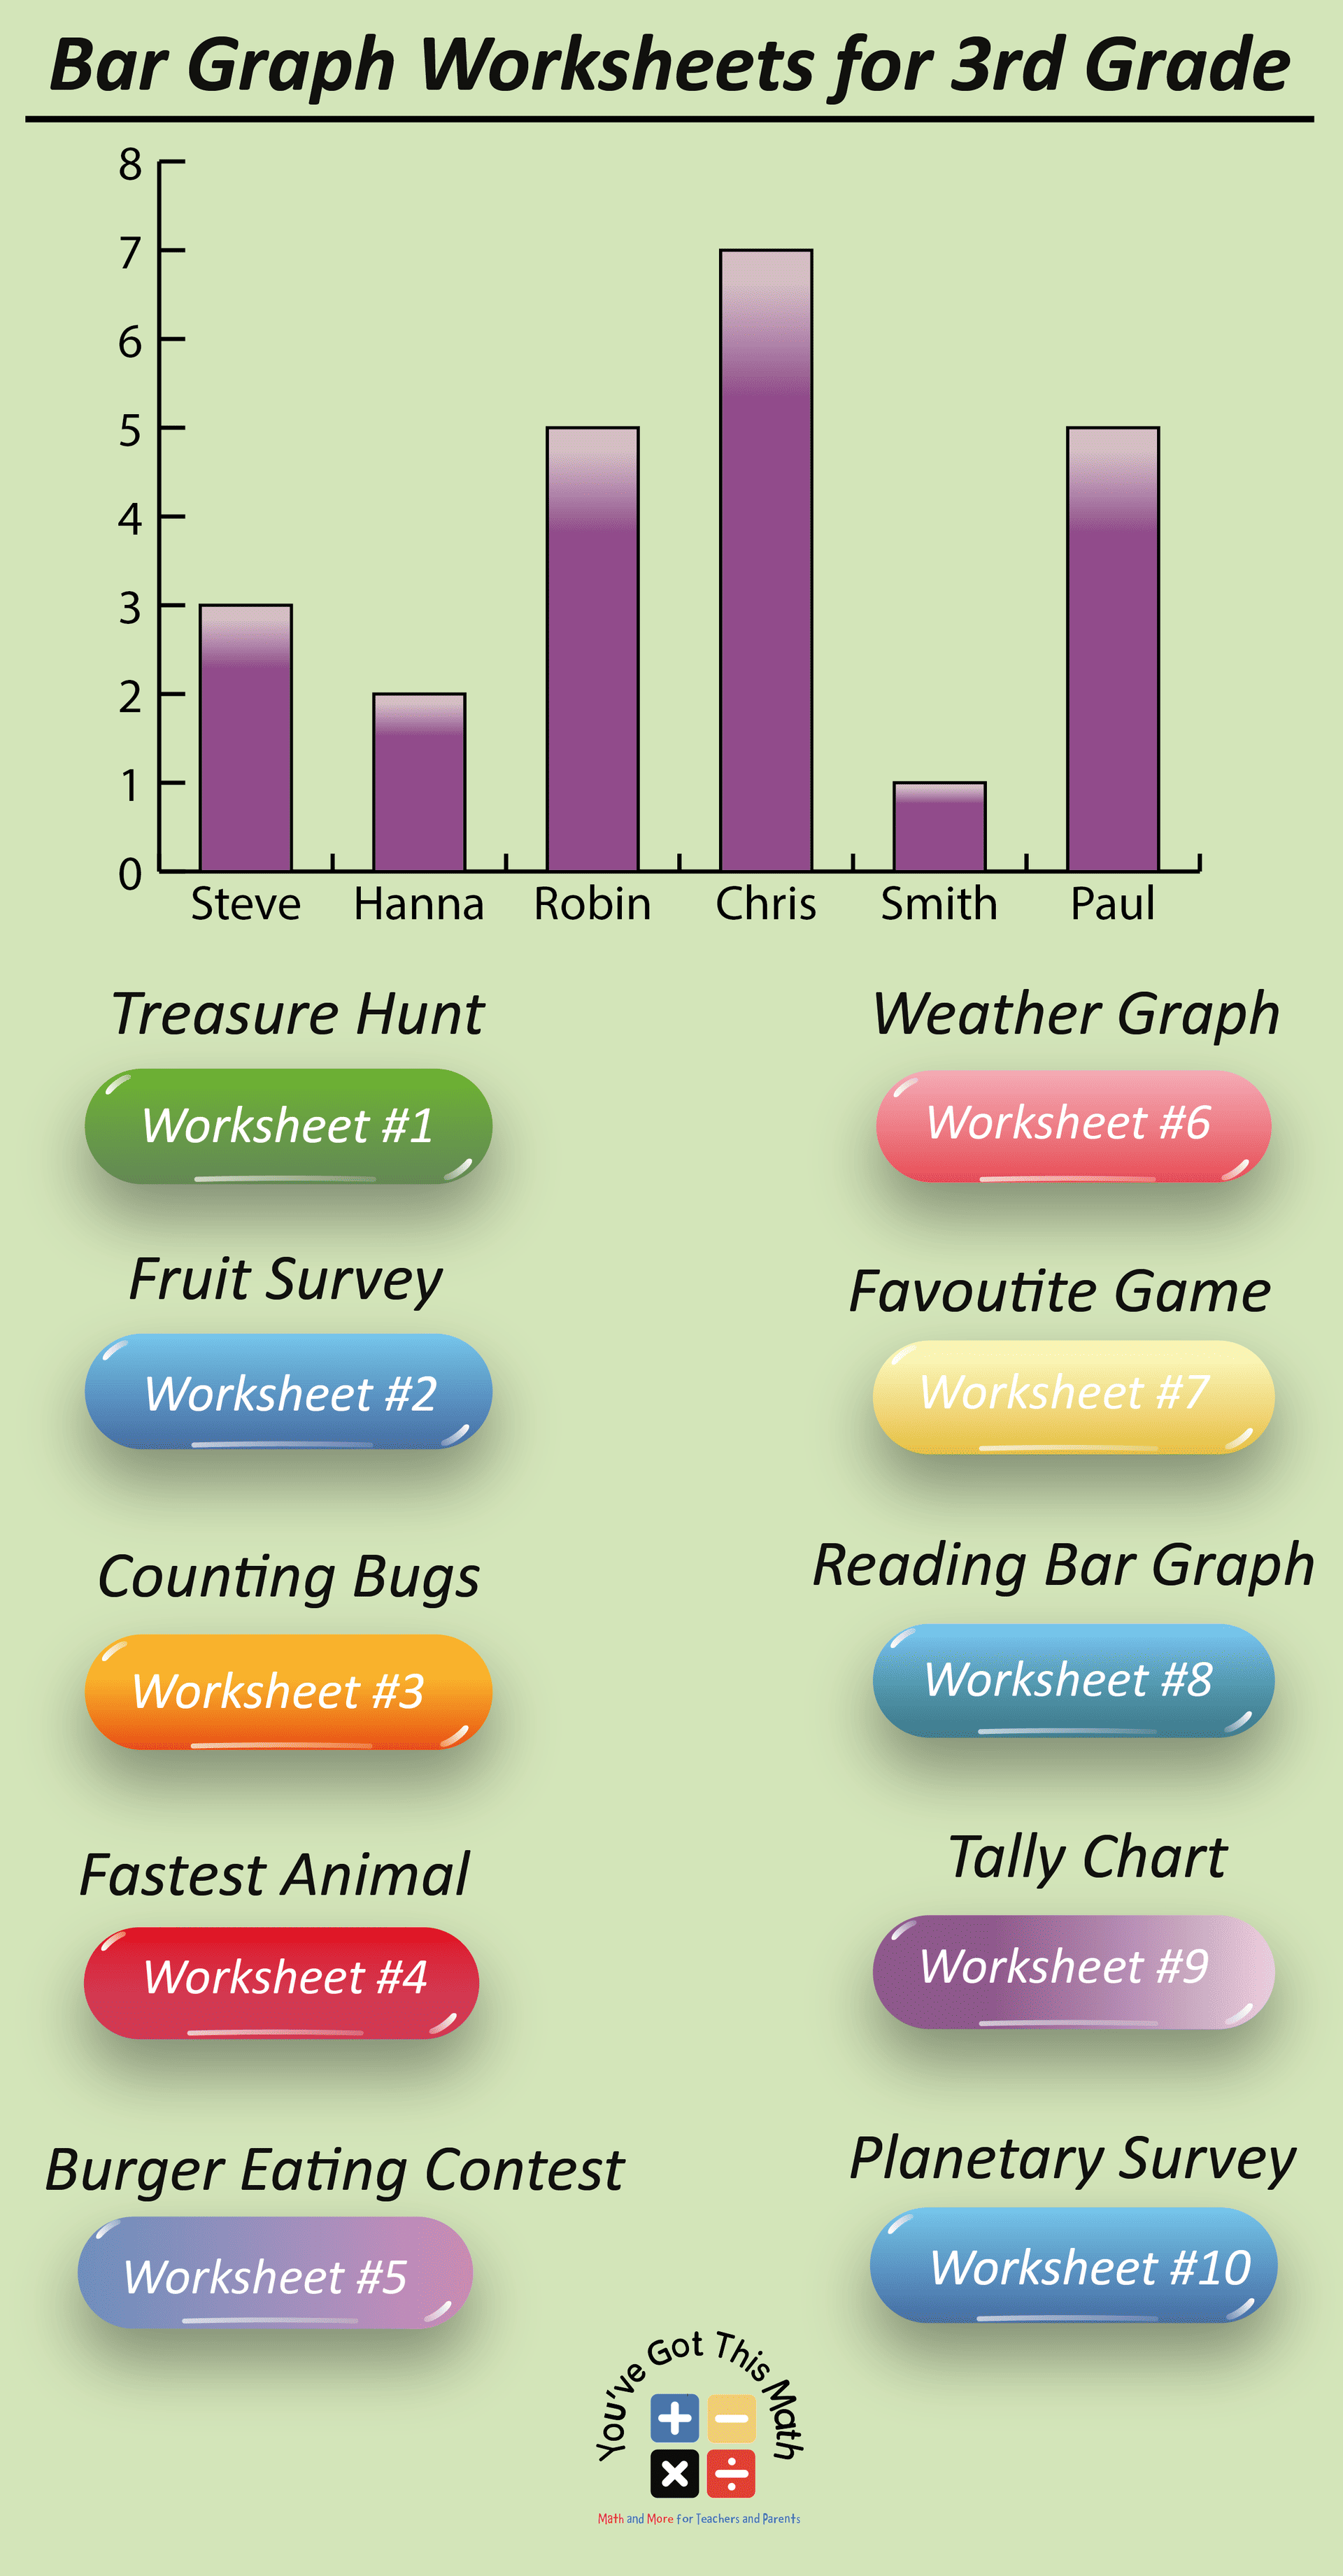
Bar Graph: Definition and Making a Bar Graph
A bar graph is a type of chart or graph that uses rectangular bars to represent and compare different categories of data. It is a visual way of displaying information, making it easier to understand and analyze.
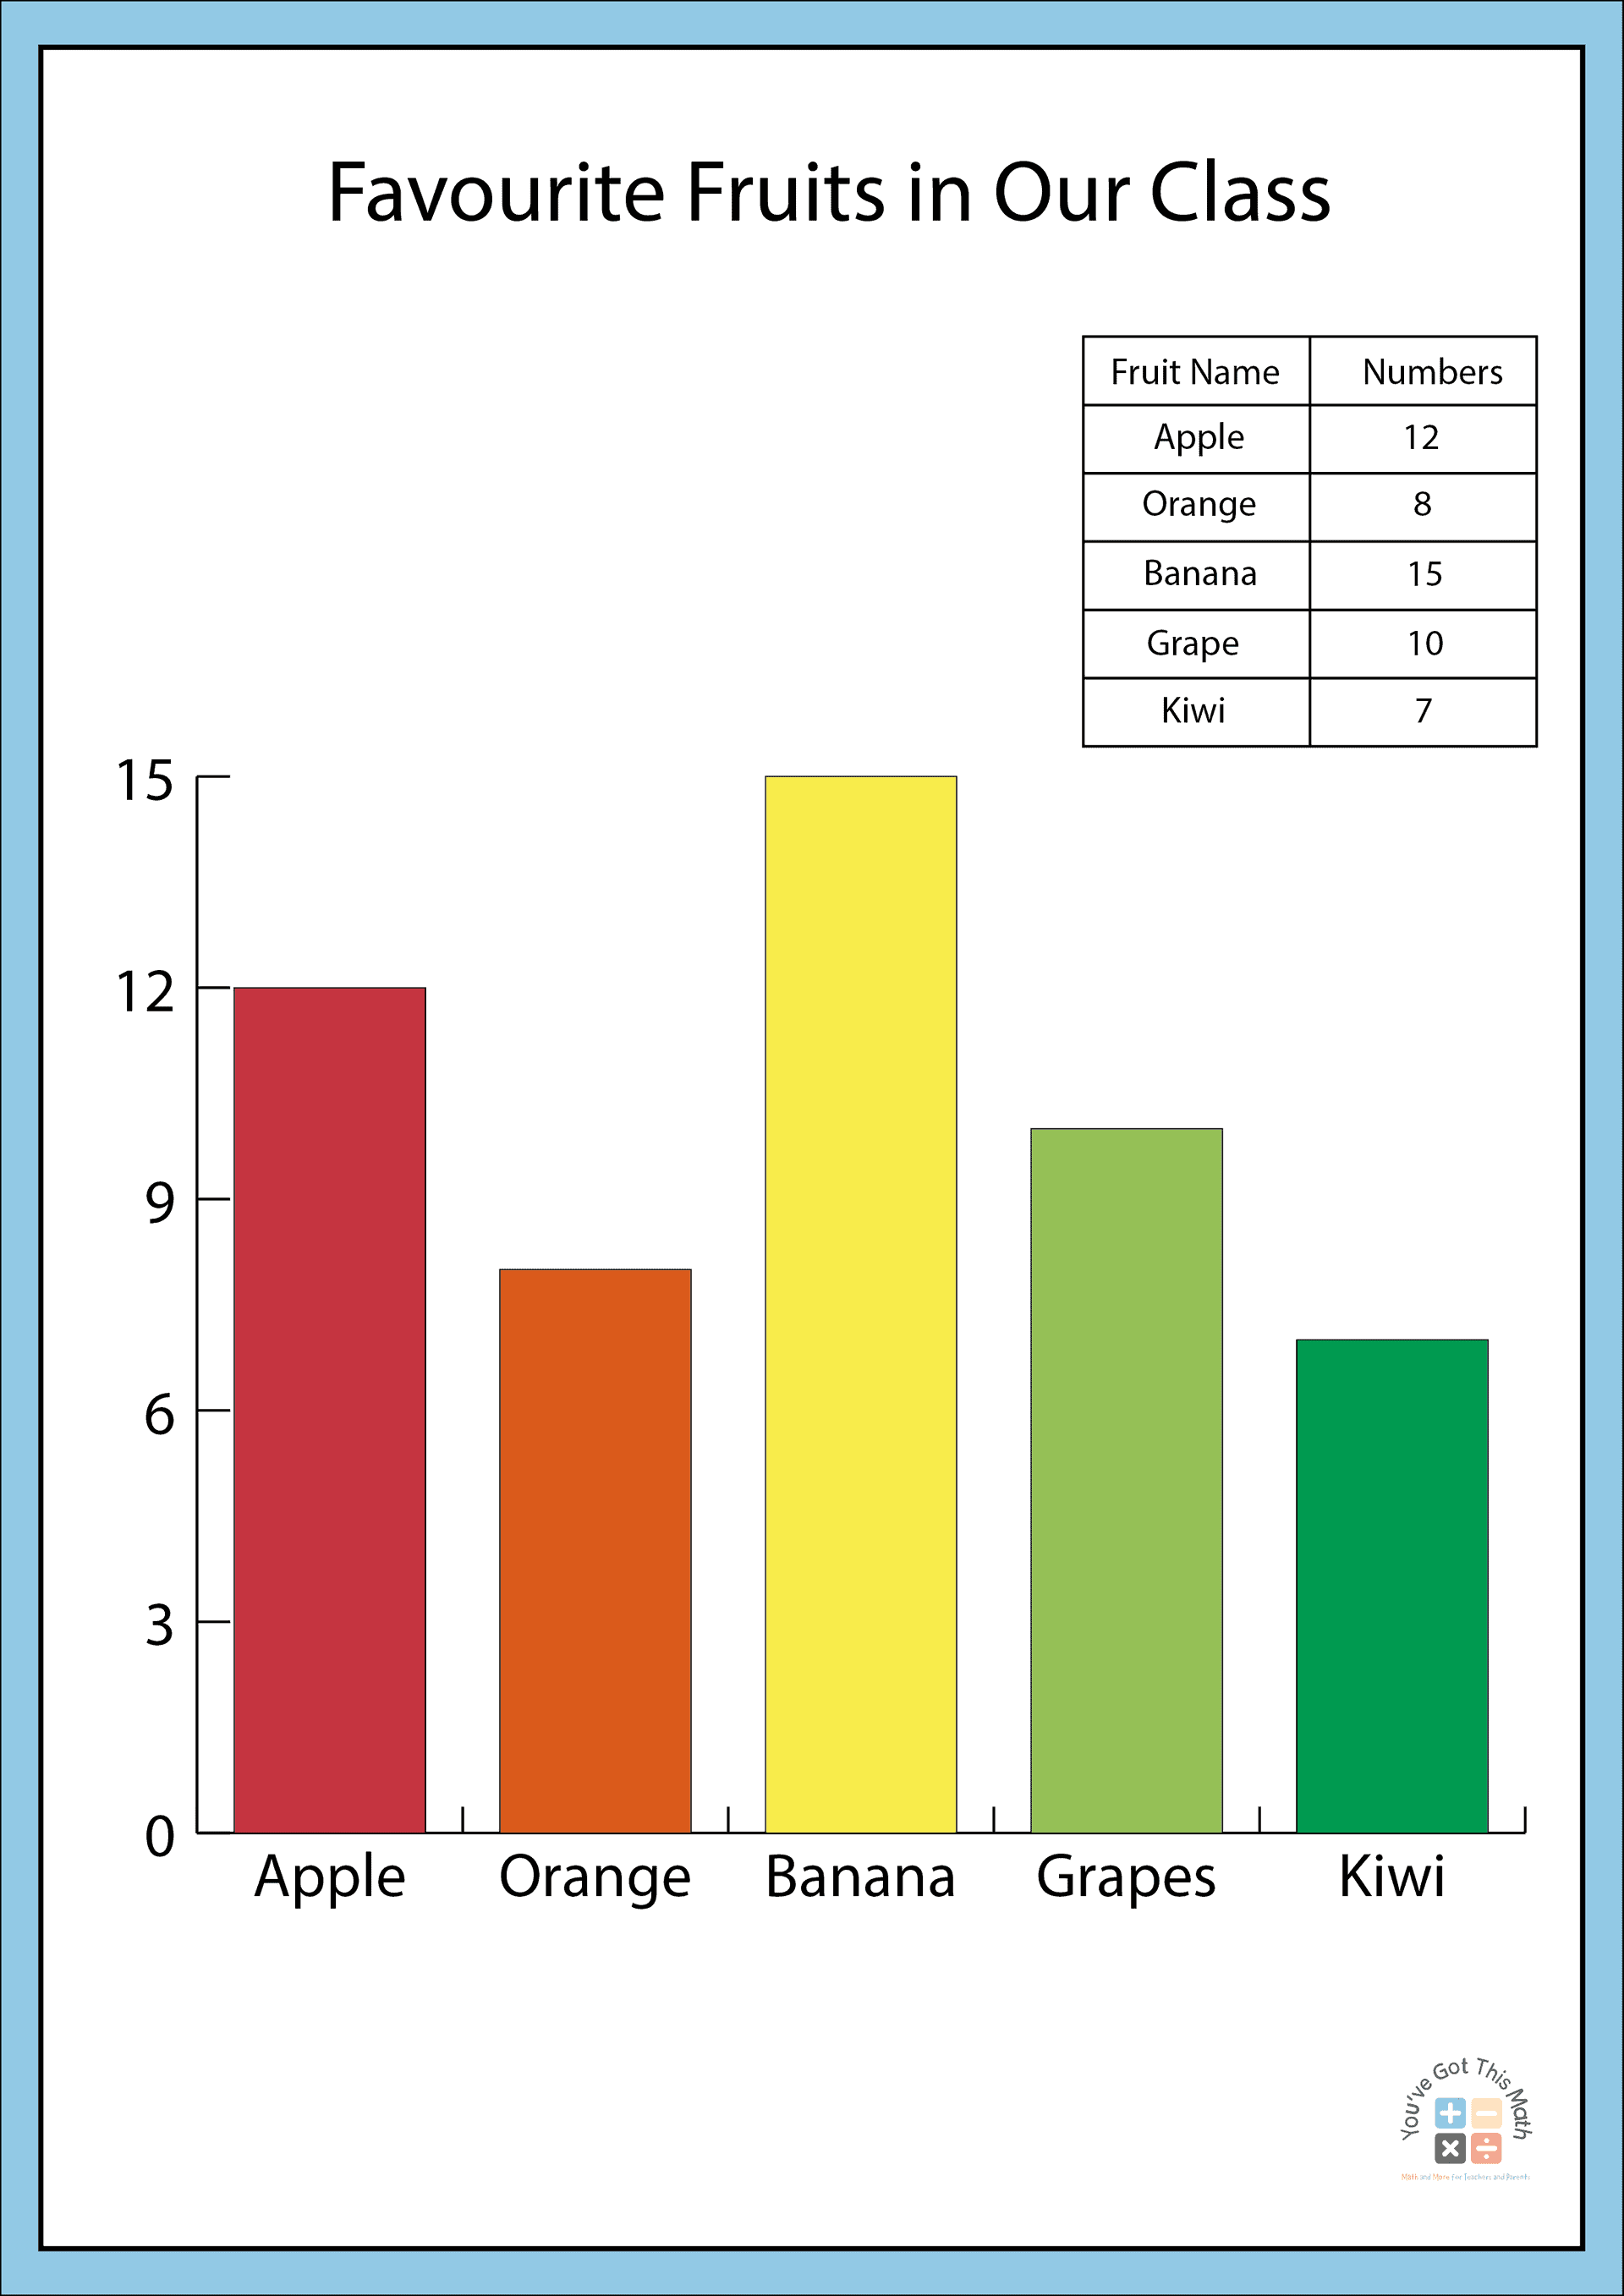
- Let’s say we want to make a bar graph to show the number of fruits each student in a class likes. We can start by choosing different fruits like apples, oranges, bananas, and grapes.
- First, draw a vertical or horizontal line on a piece of paper to create the base of your graph. This line is called the “axis.” The vertical axis goes up and down, and the horizontal axis goes left to right.
- Next, think of a title for your graph, like “Favorite Fruits in Our Class“. Write the title above or below the axis.
- Now, draw rectangles or bars above or beside the axis. Each bar represents a fruit category. For example, draw a bar for “apples” by starting from the bottom of the axis and going up to a certain height. Do the same for the other fruits, making sure the bars are all the same width.
- To make it more fun, you can use different colors for each fruit. For example, color the apple bar red, the orange bar orange, the banana bar yellow, and the grape bar purple.
- Lastly, label the vertical or horizontal axis with numbers or words to show the quantity or names of the fruits. You can use numbers to represent the number of students who like each fruit or write the names of the fruits directly.
Now you have a bar graph showing the number of students who like each fruit in your class!
Note: Remember, the taller or longer the bar, the more students like that fruit. Bar graphs help us see and understand information easily, especially when we want to compare different categories.
Scaled Bar Graph for 3rd Garde: Treasure Hunt
Here, in these bar graph worksheets for 3rd-grade students, we have plotted the number of treasures found by students. Answer the simple question from the graph. Read the graph from this PDF worksheet.
Counting and Interpreting Bar Graph: Fruit Survey
In this section, we have attached a worksheet of a fruit survey. A 3rd grader needs to interpret the bar graph and answer the question about the graph.
This is the PDF for the bar graph worksheets for 3rd grade. Try to solve this.
Counting Bugs and Creating a Bar Graph
In this section, there are lots of fun animated bugs. You need to plot them in a bar graph and then answer the question. Identify the bugs and create a bar graph. Observe the graph and give the right answers.
The PDF of the bar graph worksheets for 3rd grade is here.
Fastest Animal in a Farm Bar Graph
Here, we have given some animals listed on a farm and plotted them in a bar graph. Answer the questions from the sheet.
Here are the bar graph worksheets for 3rd grade to answer the easy questions from this PDF.
Bar Graph on Burger Eating Contest for 3rd Grade
Here the numbers of eating burgers are plotted into a bar graph. Answer the simple question by reading the graph.
This is the bar graph worksheet for 3rd grade. Answer these simple questions.
Plotting Weather Bar Graph for 3rd Grade
Here, we have plotted the average temperature for different months. Practice the worksheet to give the answers to the questions correctly.
Here is the PDF of bar graph worksheets for 3rd grade for plotting a weather graph.
Making Favorite Game in a Bar Graph
What’s your favorite game? Is it soccer? Or is it basketball? We surveyed different students’ favorite games and then plotted them in the bar graph. Read the graph and from this data.
Answer the questions from this bar graph worksheet for 3rd grade.
Creating a Reading Bar Graph for 3rd Grade
This bar graph is all about finding the real number of elements from the graph.
Try to solve this PDF of bar graph worksheets for 3rd grade.
Tally Chart to Show Bar Graph for 3rd Grade
You may be introduced to a tally chart earlier in your class. It is a number-counting process with the help of a tally. So, in this worksheet, you will find out some necessary utilities for a student while going to class. The amount is represented in a tally. From the tally chart, you need to plot a bar graph and answer the simple questions.
In this PDF the bar graph worksheets 3rd grade is shown with the tally chart. Draw the bars with the help of the tally chart.
Title, Labeling Axis, Scaling in a Bar Graph for Planetary Survey
In our exciting Planetary Survey, we create a special bar graph to learn about the planets in our Solar System. Using a vertical and horizontal axis, we label the planets and interesting facts. Each planet gets its own colorful bar, with the height showing the number of satellites for each planet.
Practice this PDF of bar graph worksheets 3rd grade properly for labeling, scaling, and graphing.
Download Practice Worksheet PDF
This is the combined PDF attaching all the worksheets.
So, these are the bar graph worksheets 3rd grade PDF. These free interactive worksheets help the students to realize the basics of bar graphs and also they will be able to read the graphs by answering the questions. Please, download the free printable worksheets for practice.

Welcome to my blog. I am Fahim Shahriyar Dipto. Currently, I am working as a content developer in You Have Got This Math. I will post math-related articles here from now on. I have completed my bachelor’s degree in Mechanical Engineering from BUET. So, I am a mechanical graduate with a lot of interest in research and exploring new work. I always try to think of something creative and innovative. So, I choose to write creative content here.
