6 Free Plotting Rational Numbers on a Number Line Worksheet
Buy 2700+ Pages Math Games & Activities (PreK-2nd Grade)
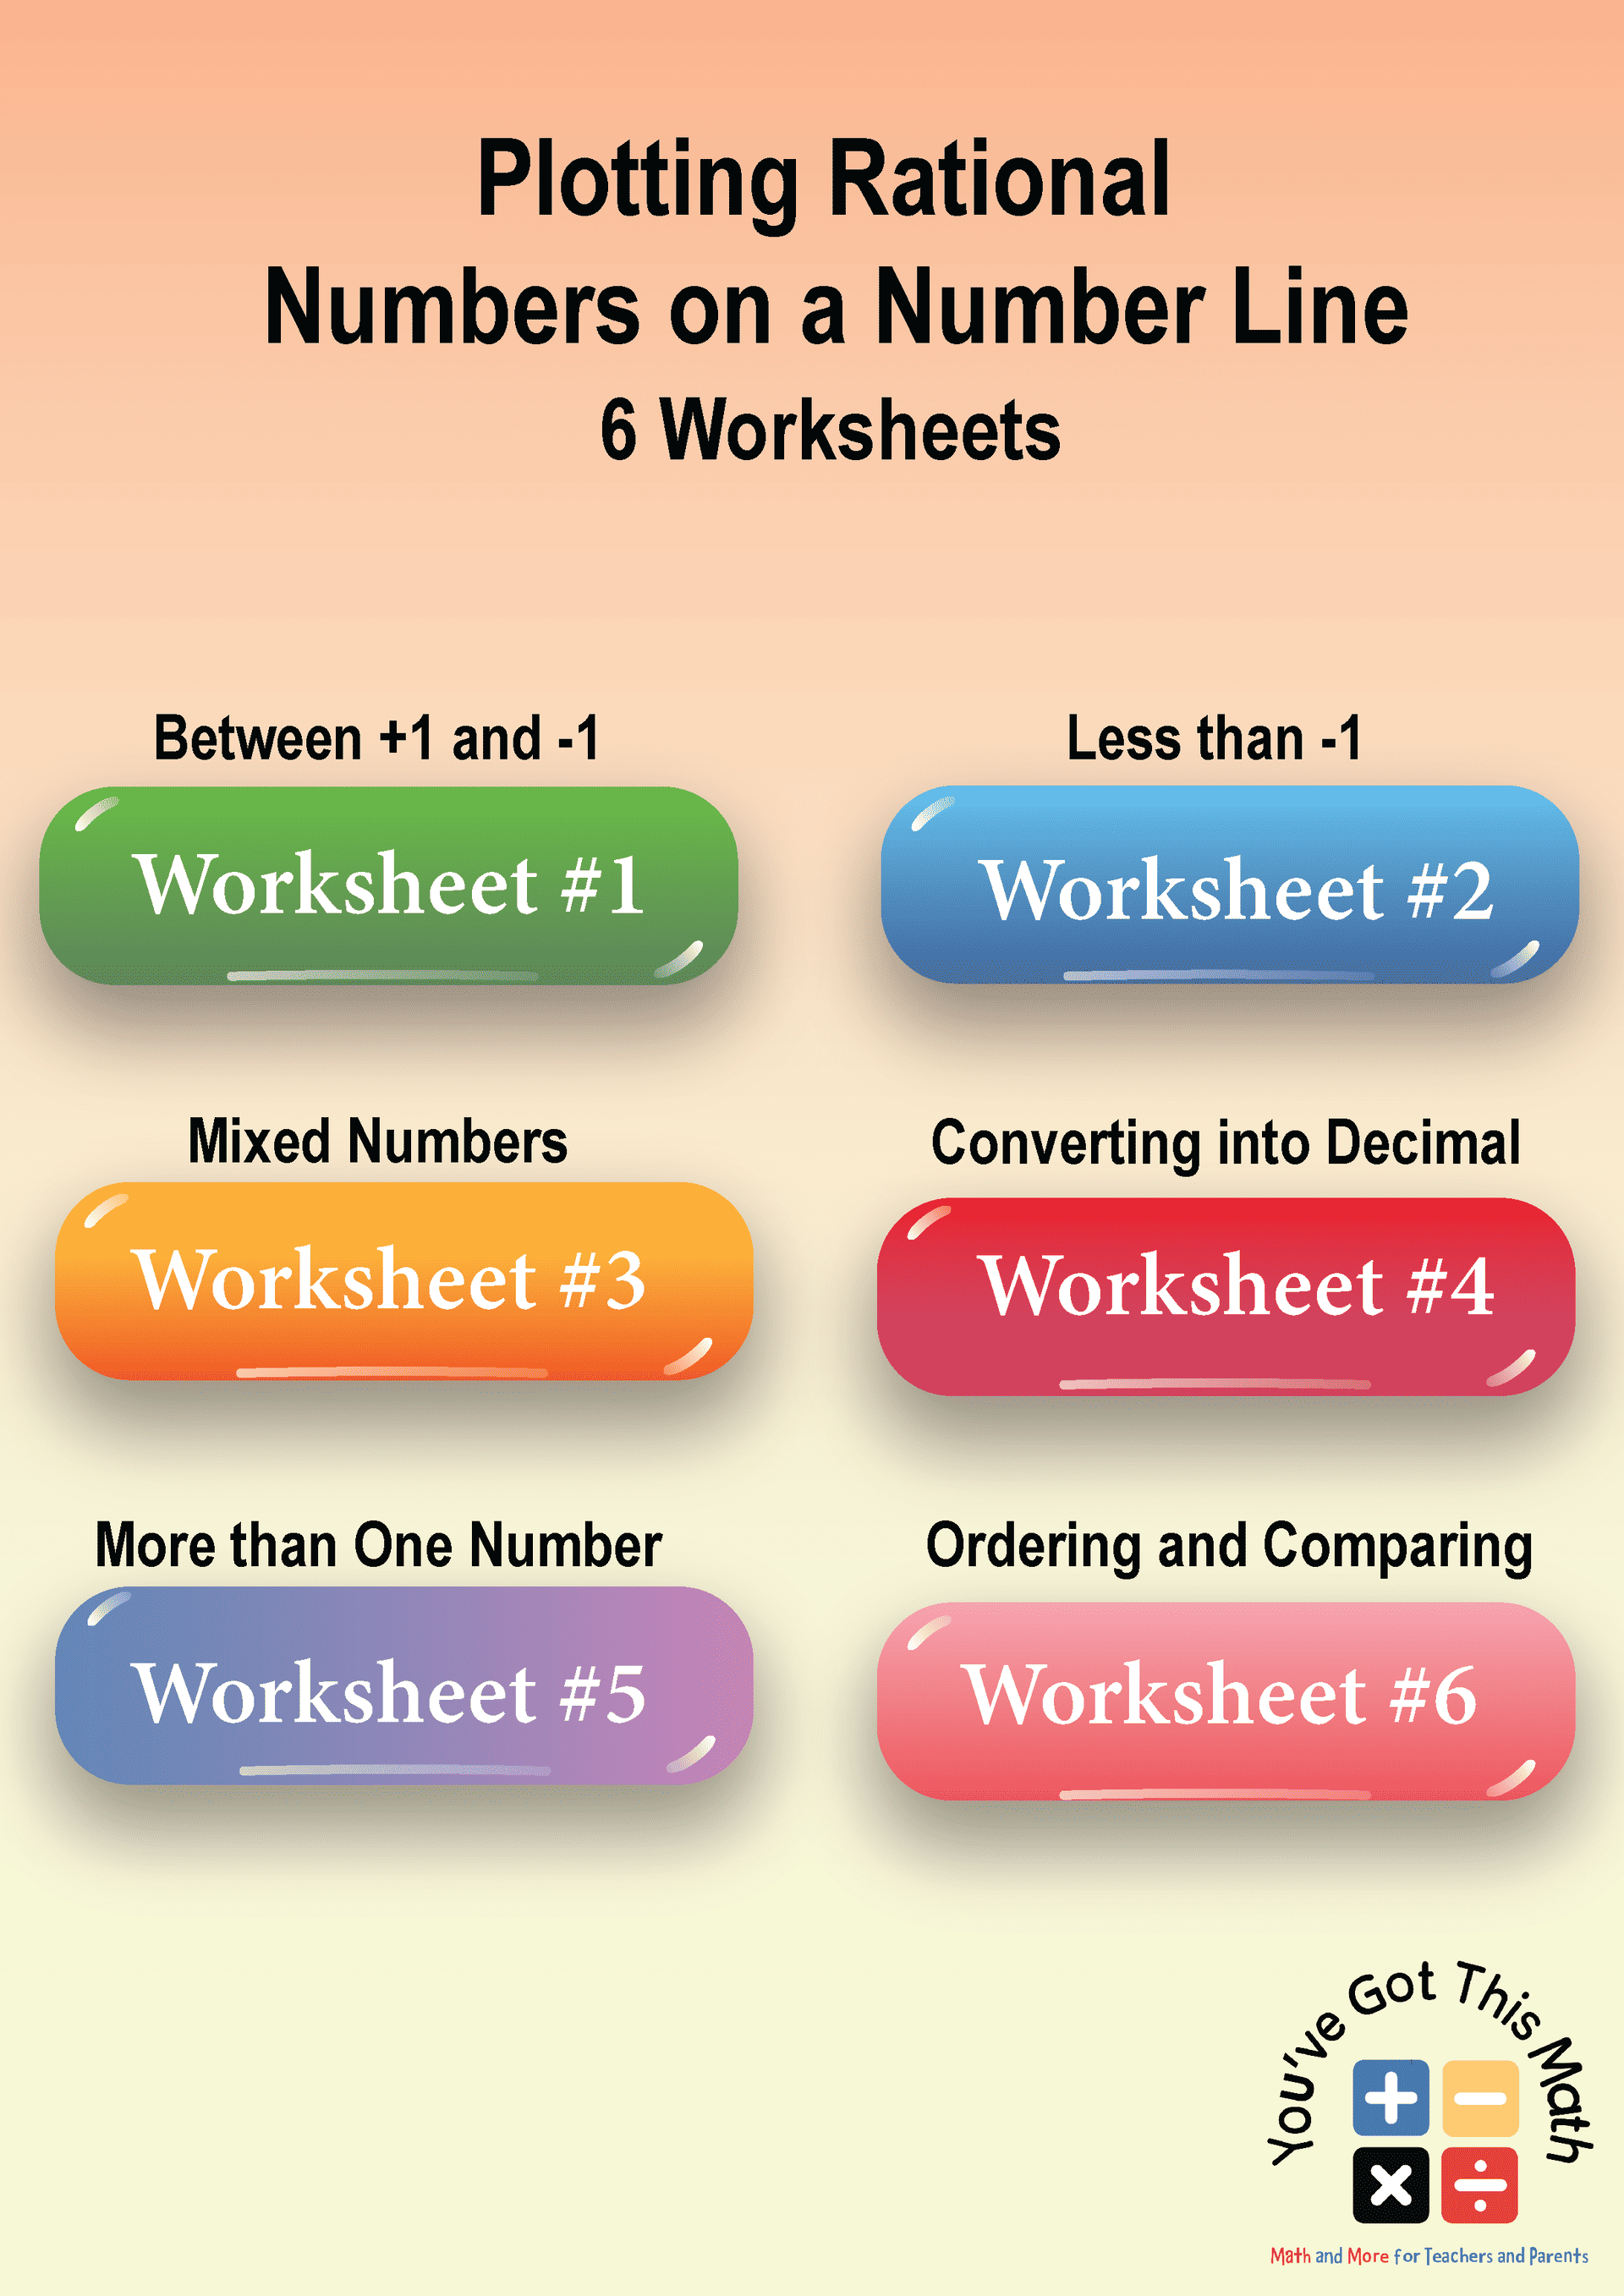
These rational numbers on a number line worksheet will help to learn the technique of plotting rational numbers on a number line through some interesting activities. 6th-7th grade students will be able to plot rational numbers on number lines through various methods and can improve their basic math skills with our free printable interactive worksheets.
6 Exciting Plotting Rational Numbers on a Number Line Worksheet
Please download the following plotting rational numbers on a number line worksheet and practice plotting rational numbers on the pages.
Introduction to Rational Numbers
Before we start the article, let’s understand some important topics.
Rational numbers
These are special numbers that can be written as fractions, where the numerator and denominator are both whole numbers. They include positive and negative numbers, as well as zero. Examples of rational numbers are 1/2, -3/4, 2, -5, and 0.
Number line
A number line is a straight line that helps us visualize and compare numbers. In a number line, the positive numbers are to the right, and the negative numbers are to the left, where the center is counted as zero (0).
You can learn more information regarding number lines from another article 15+ Free Inequalities on a Number Line Worksheet from our site.
Plotting Positive Rational Numbers
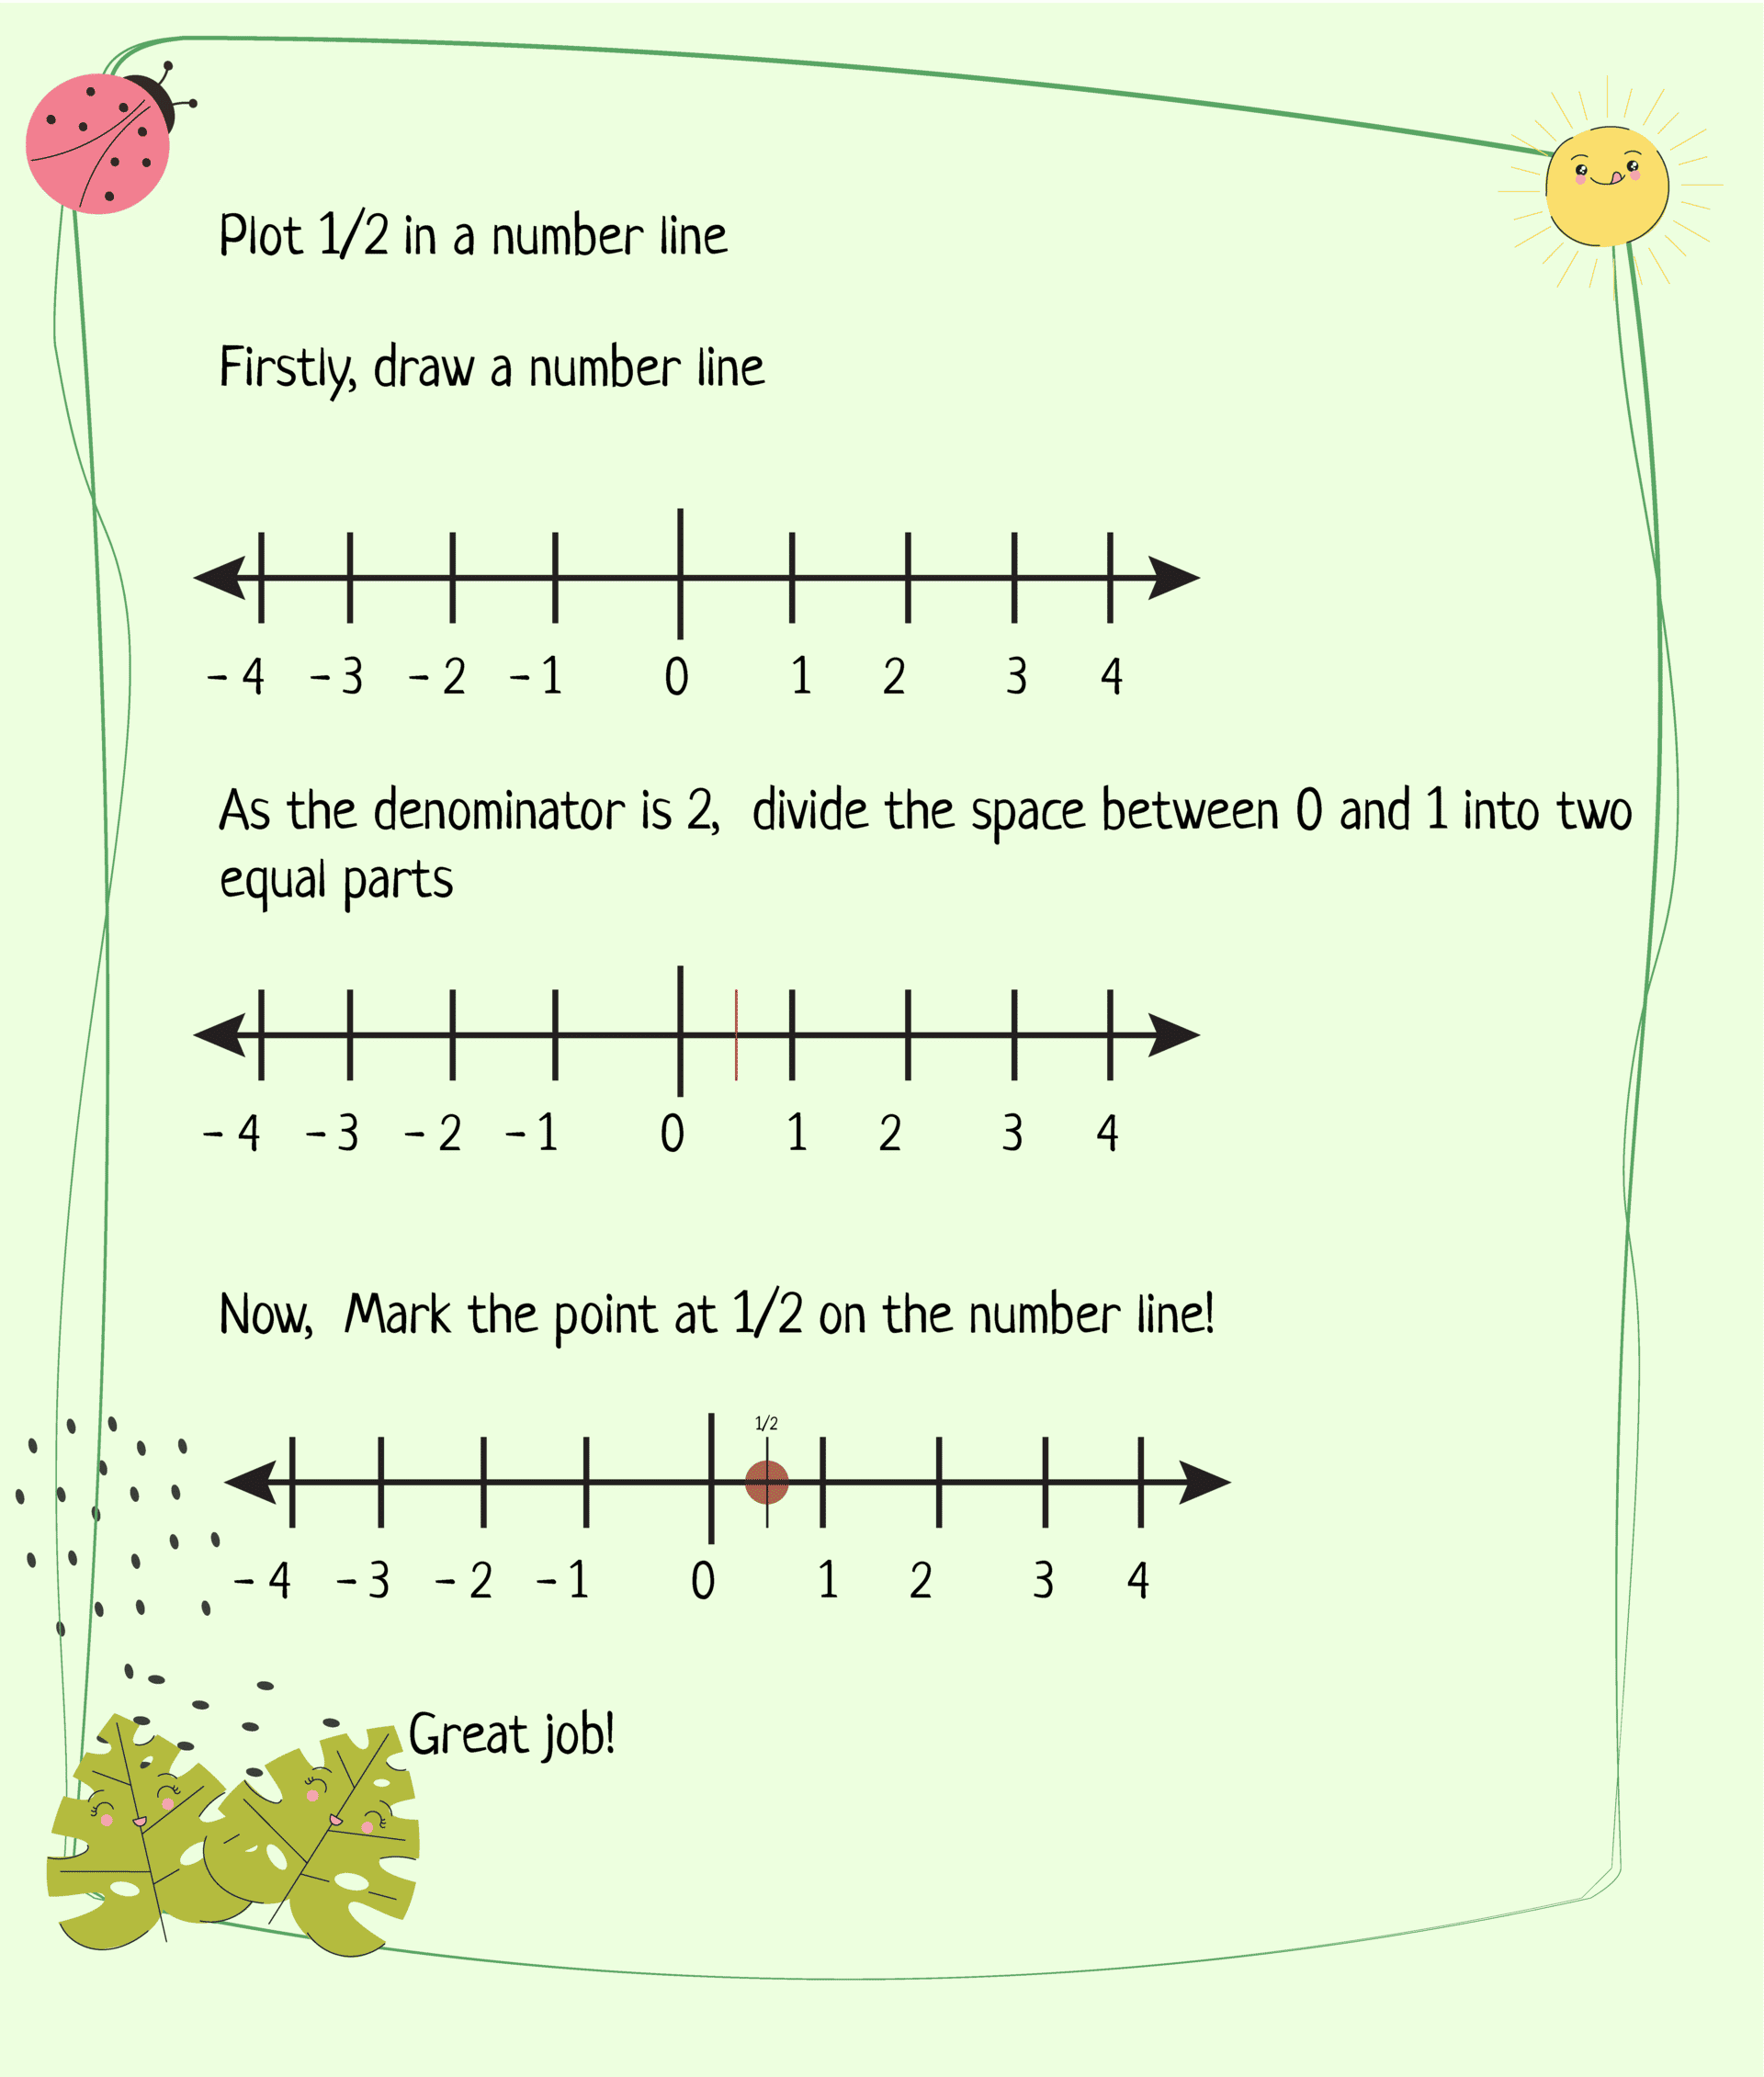
Let’s see how to plot positive rational numbers. For example, you want to plot 1/2. Find the number 1 on the number line. Now, you need to divide the space between 0 and 1 into two equal parts because the denominator is 2. Mark the point at 1/2. Great job!
Now, let’s plot 3/4. Find 0 on the number line, and then move to the right until you reach 1. Since the denominator is 4, divide the space between 0 and 1 into four equal parts. Mark the point at 3/4. Fantastic!
What will you do when the number is 2? It’s easy, little learners! Since 2 is a whole number, you can place it exactly on the line. Superb!
Plotting Negative Rational Numbers
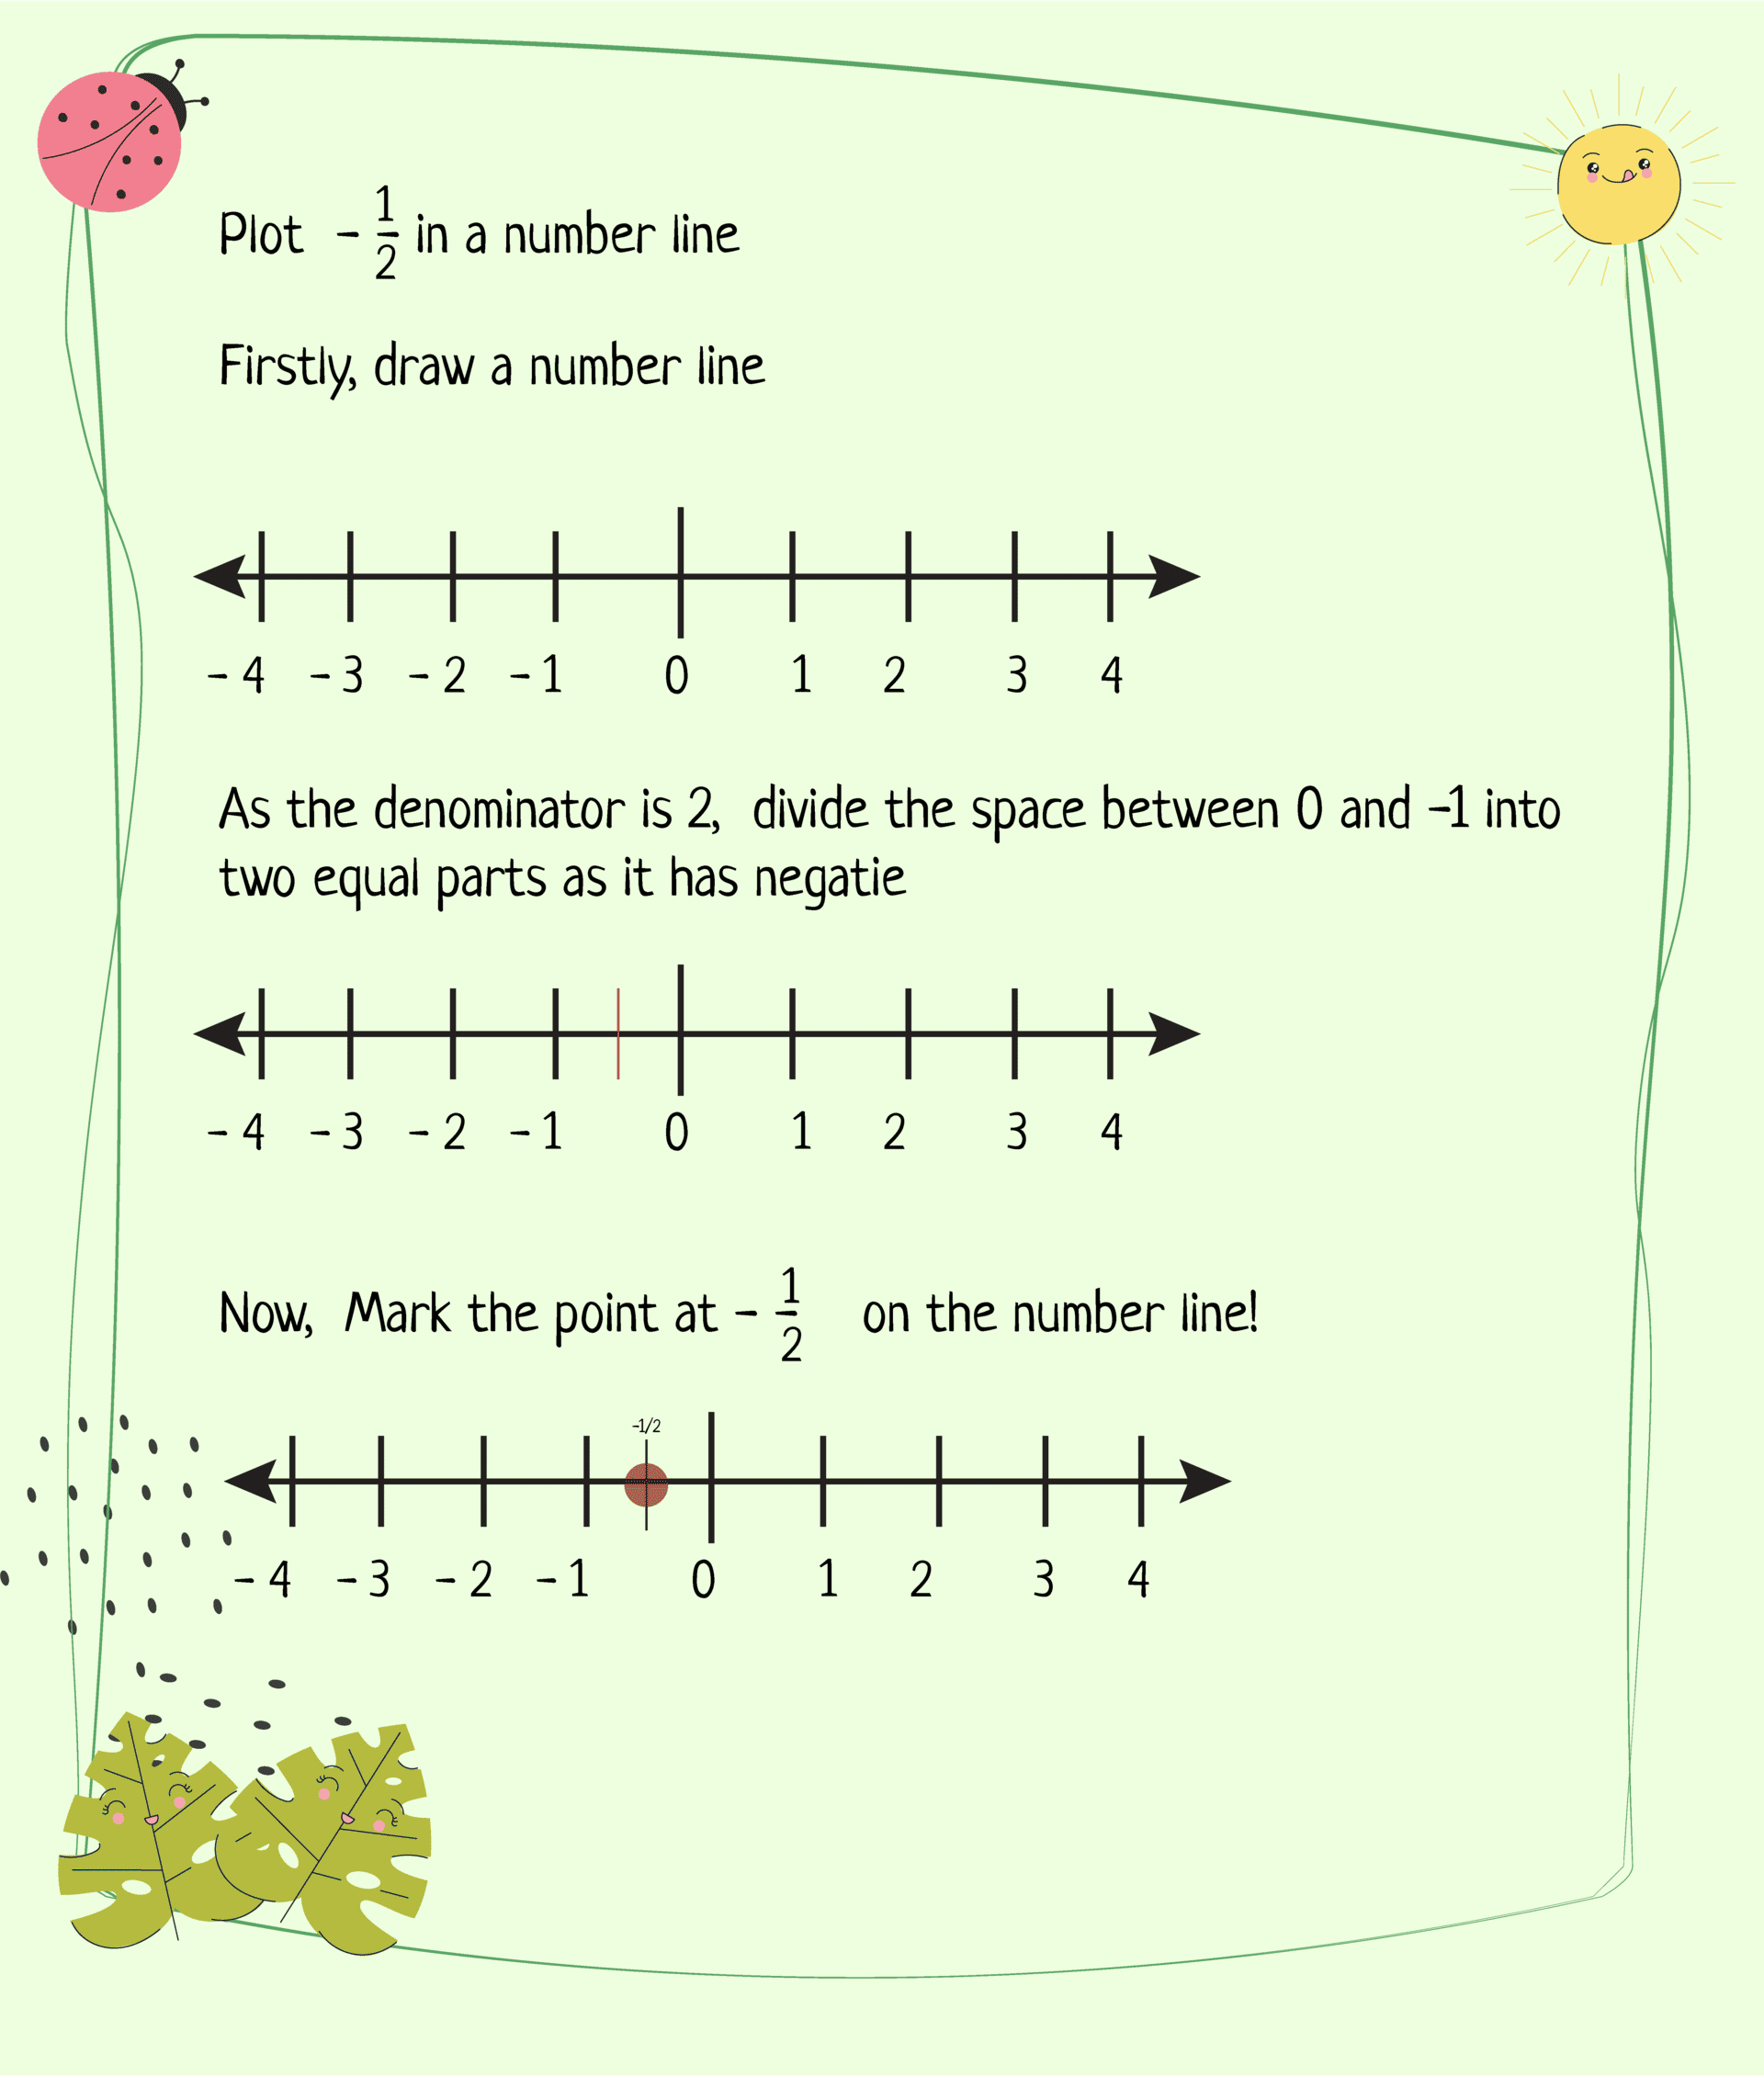
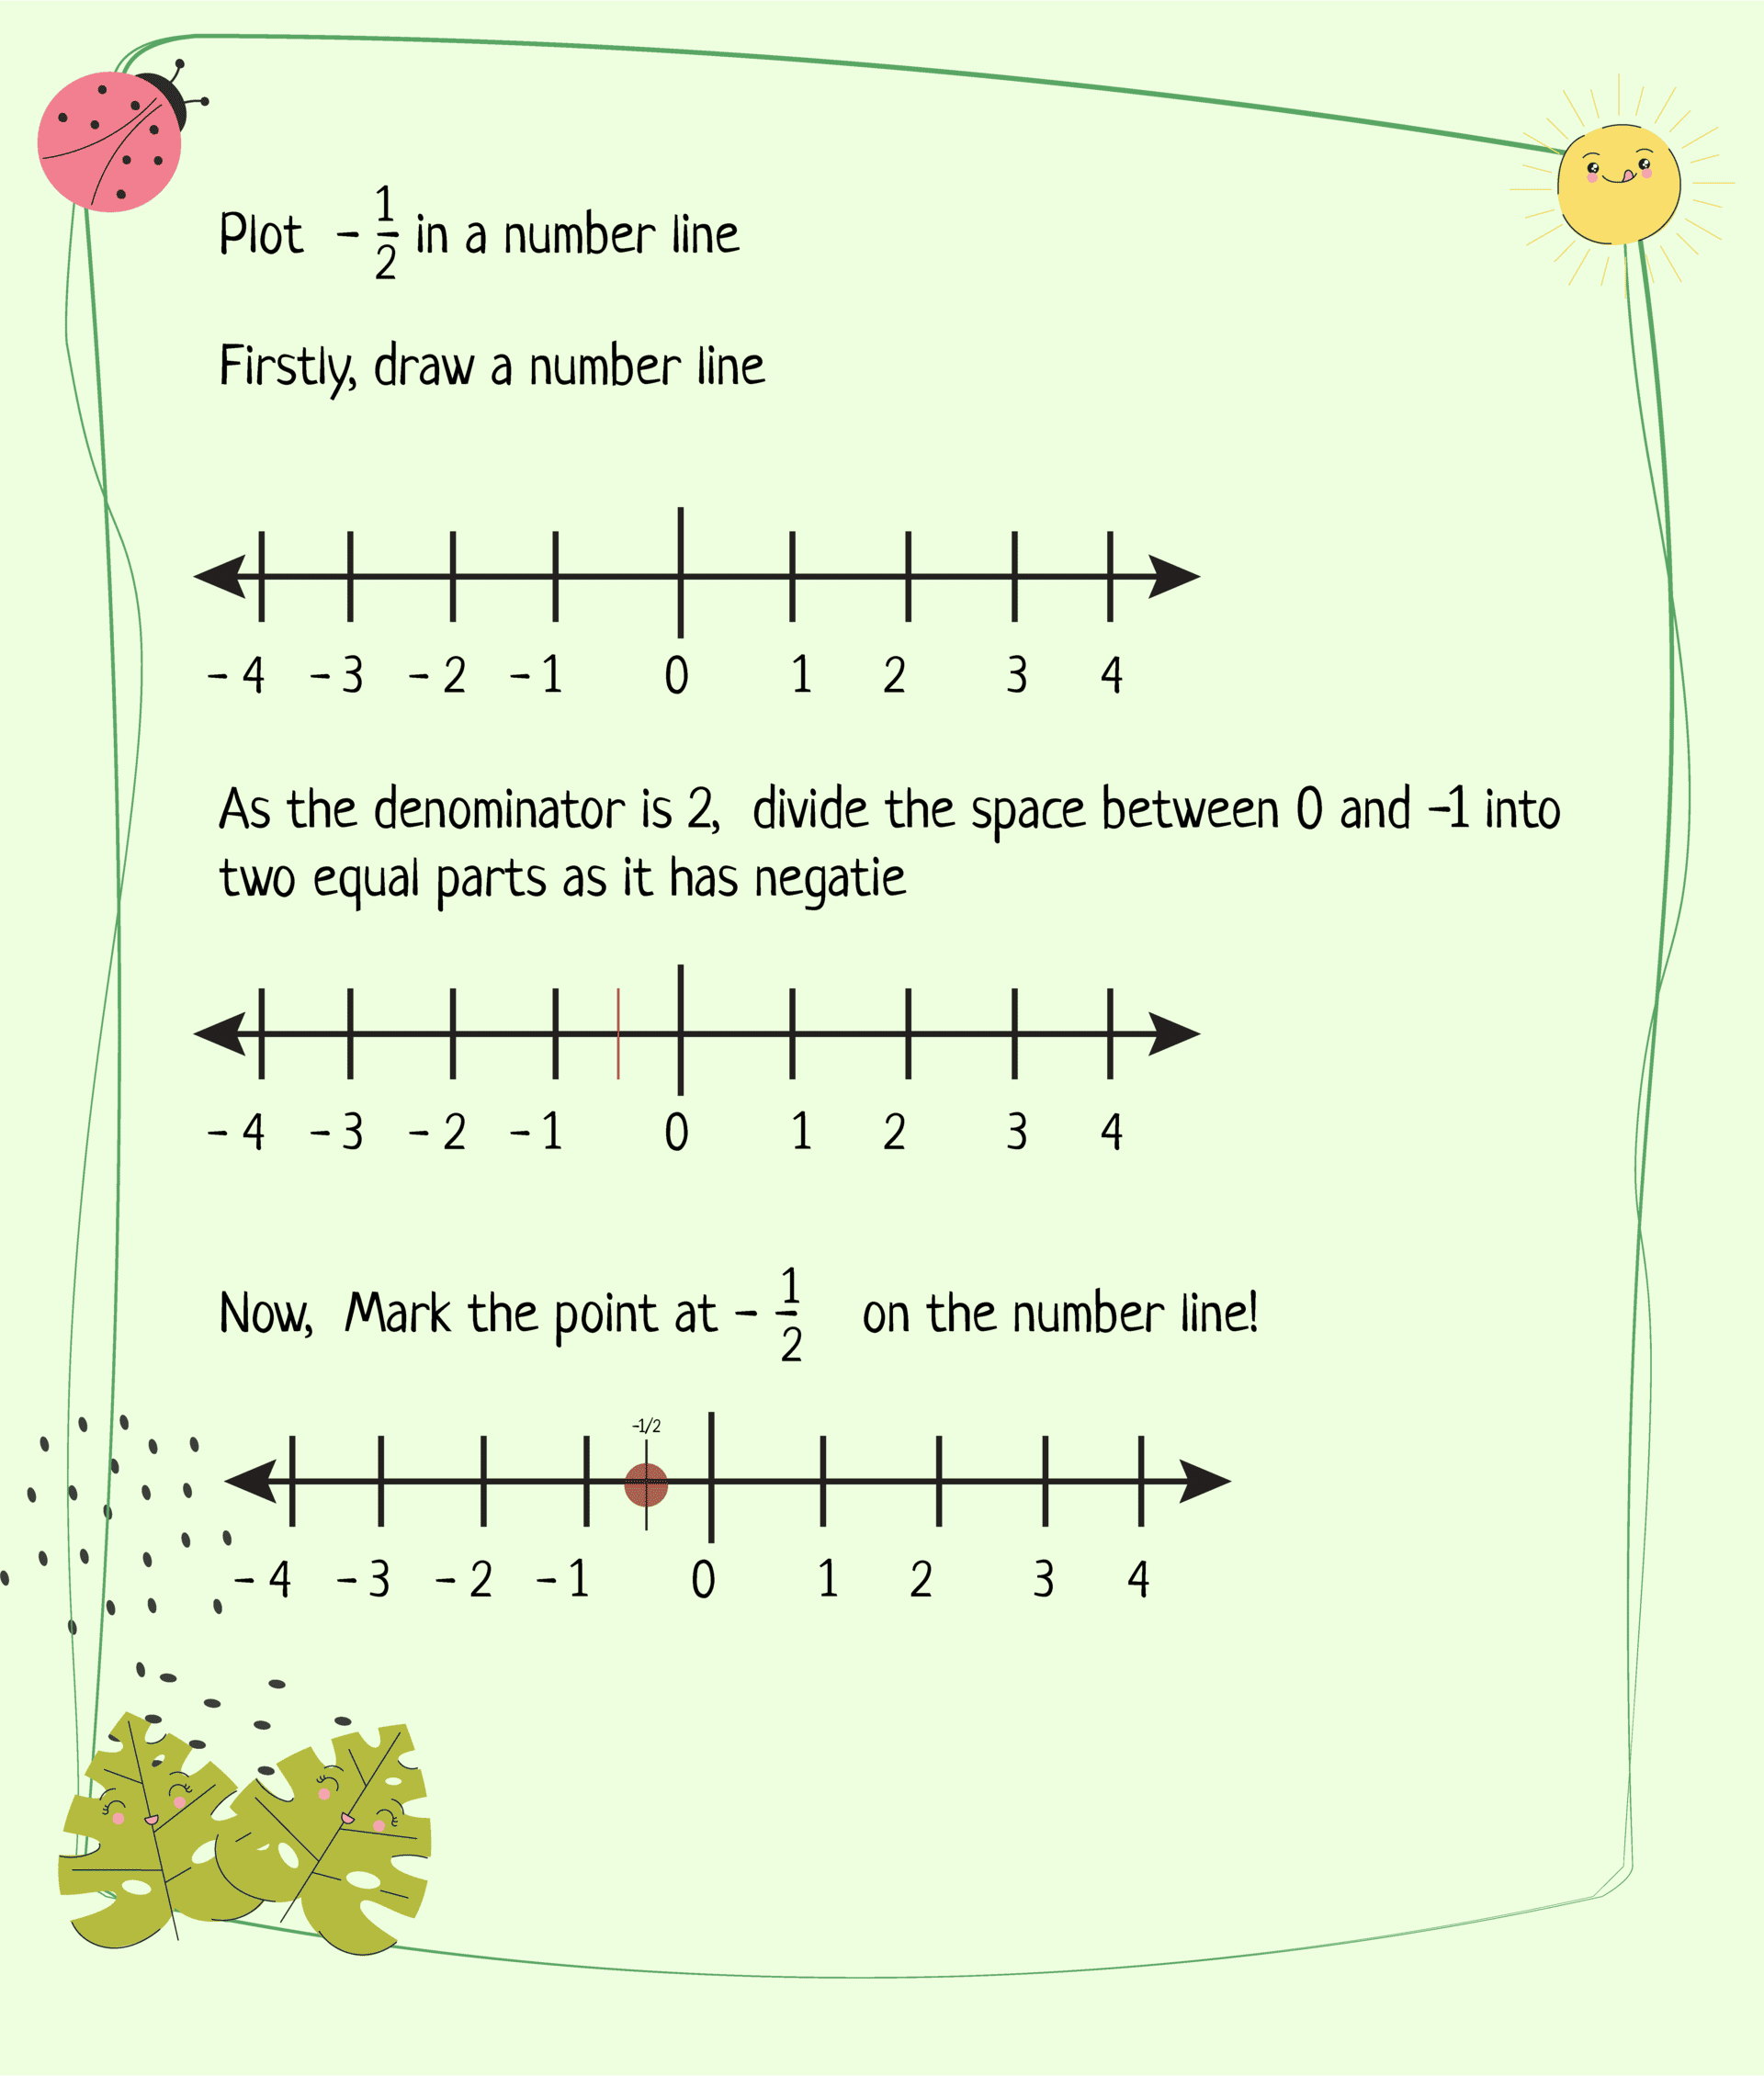
Now let’s see how to plot negative rational numbers. For example, the number is -1/2. Remember, the negative sign tells us to move to the left. So, start at 0, divide the space between 0 and -1 into two equal parts, and mark the point at -1/2. Well done!
Can you plot the number -4, on the number line? Since -4 is a whole number, place it exactly on the line to the left of 0. Fantastic job!
Plotting Rational Numbers between +1 and -1 on a Number Line
Plotting rational numbers between +1 and -1 on a number line is a way to help you understand the density of rational numbers in this interval.
Here’s a step-by-step guide to plotting rational numbers between +1 and -1:
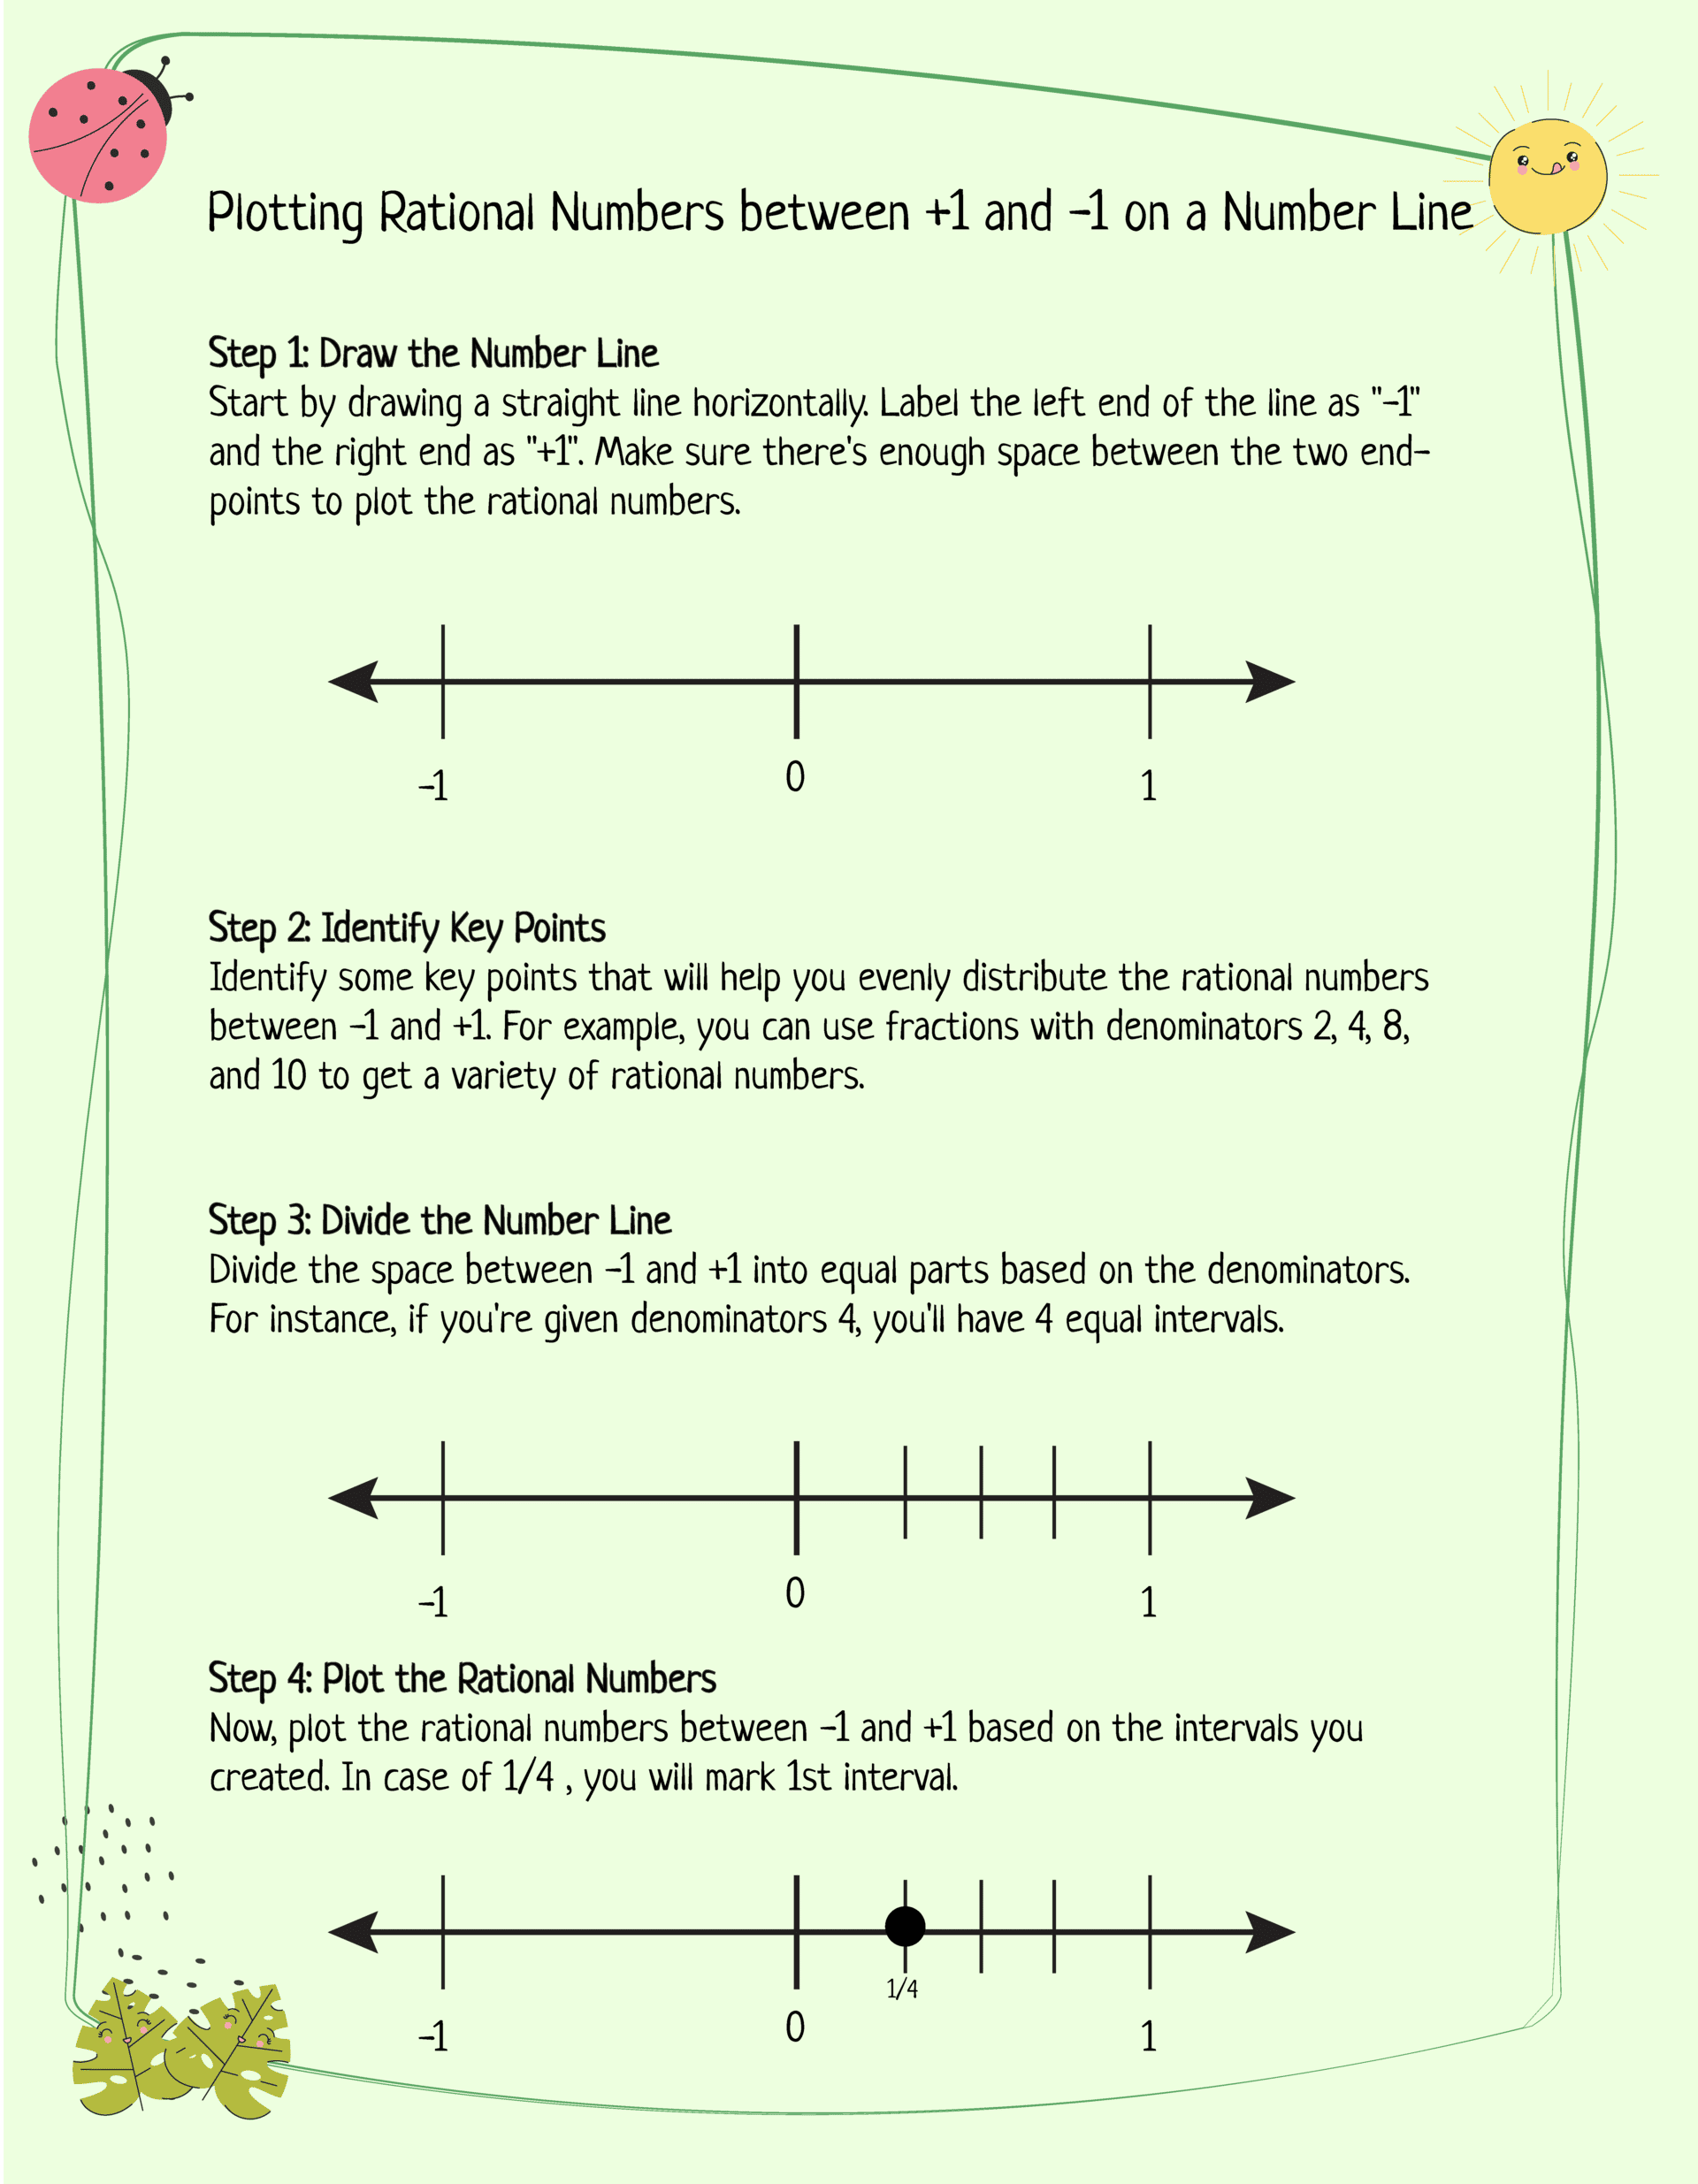
Step 1: Draw the Number Line
Start by drawing a straight line horizontally. Label the left end of the line as “-1” and the right end as “+1”. Make sure there’s enough space between the two endpoints to plot the rational numbers.
Step 2: Identify Key Points
Identify some key points that will help you evenly distribute the rational numbers between -1 and +1. For example, you can use fractions with denominators 2, 4, 8, and 10 to get a variety of rational numbers.
Step 3: Divide the Number Line
Divide the space between -1 and +1 into equal parts based on the denominators. For instance, if you’re given denominators 2, 4, 8, and 10, you’ll have 2, 4, 8, and 10 equal intervals, respectively.
Step 4: Plot the Rational Numbers
Now, plot the rational numbers between -1 and +1 based on the intervals you created. For each fraction, find the corresponding interval on the number line and mark the point.
Let’s understand this with an example.
Now, let’s solve some exciting exercises.
Plotting Rational Numbers Less than -1 on a Number Line
Plotting rational numbers less than -1 on a number line can be a helpful exercise to explore how negative fractions and whole numbers extend beyond -1.
Here’s a step-by-step guide for plotting rational Numbers less than -1 on a number line:
Step 1: Draw the Number Line
Begin by drawing a horizontal line. Label the left end “-2” to create some space for the rational numbers you’ll plot and the right end “-1”.
Step 2: Divide the Number Line
Since we’re plotting numbers less than -1, the line will extend to the left. Divide the space to the left of -1 into equal intervals to represent the rational numbers.
Step 3: Plot the Rational Numbers
Now, plot the rational numbers less than -1 on the number line based on the intervals you created. For each fraction, find the corresponding interval on the number line and mark the point.
Keep in mind that there are infinitely many rational numbers less than -1, so you can explore more fractions with different denominators to see how they extend further to the left on the number line.
Let’s go through an example.
Let’s solve some exercises.
Plotting Mixed Numbers on a Number Line
Plotting mixed numbers on a number line is an important skill that helps kids visualize and understand the position of fractions and whole numbers relative to each other. Here’s a step-by-step guide to plotting mixed numbers on a number line:
Step 1: Draw the Number Line
Draw a horizontal line and label the endpoints based on the range you want to cover. For example, you can label the left end as -2 and the right end as +2 to include a range of mixed numbers.
Step 2: Divide the Number Line
Divide the number line into equal intervals to make it easier to plot the mixed numbers accurately. The number of intervals will depend on the scale you choose for the number line.
Step 3: Identify Whole Numbers and Fractions
Look at the mixed numbers you want to plot. Separate the whole numbers from the fractional parts. For example, in the mixed number 1 3/4, 1 is the whole number, and 3/4 is the fractional part.
- Whole number part: Locate the position of whole numbers on the number line. For example, if you want to plot the whole number 1, find the point labeled “1” on the number line and mark it.
- Plot the Fractional Parts: Now, focus on the fractional parts of the mixed numbers. Find the point on the number line that corresponds to the fraction. For example, if you want to plot 3/4, divide the interval between 0 and 1 (or any other whole number) into four equal parts, and mark the point that is three parts away from 0.
Step 4: Combine Whole Numbers and Fractions
After plotting the whole numbers and fractional parts, combine them to represent the mixed numbers on the number line. For example, if you have plotted 2 and 3/4 separately, combine them to show the mixed number 2 3/4.
Plotting Rational Numbers on Number Line by Converting Them into Decimal Numbers
Converting rational numbers into decimal numbers can be a helpful alternative approach for plotting on a number line. Here’s a step-by-step guide to doing this:
Step 1: Draw the Number Line
Begin by drawing a horizontal line on a piece of paper or a whiteboard. Label the endpoints based on the range you want to cover, such as from -3 to +3.
Step 2: Convert Rational Numbers to Decimals
To convert a rational number to a decimal, divide the numerator by the denominator. You can use a calculator for more complex fractions. For example, 1/2 as a decimal is 0.5 (1 ÷ 2 = 0.5) 3/4 as a decimal is 0.75 (3 ÷ 4 = 0.75)
Step 3: Plot the Decimal Numbers on the Number Line
Using the decimal equivalents, find the positions of the rational numbers on the number line and mark them. So, get ready with your thinking cap and start with some exercises.
Worksheet for Plotting More than One Rational Number on Same Number Line
In this activity, your mission is to plot more than one rational number on the same number line. The process is the same as before. Just follow the steps and plot the following rational numbers on the number line provided.
Use different colors or symbols to represent each number. Remember to convert them to decimals if needed.
Ordering and Comparing Rational Numbers and Plotting Them on Number Line
Here’s a step-by-step guide to ordering and comparing rational numbers and plotting them on a number line.
- Order the following rational numbers from least to greatest.
- Plot each rational number on the number line provided.
- Use different colors or symbols for each number to make it clear. So, let’s do some exercises!
Download Free Printable PDF
Download the following combined PDF and enjoy your practice session.
So today, we’ve discussed plotting rational numbers on a number line worksheet using the concepts of plotting numbers between -1 to 1, less than 1, mixed numbers, decimals numbers, more than one number, and ordering and comparing numbers. Download our free worksheets and after practicing these worksheets, students will surely improve their mathematical skills and have a better understanding of this topic.

Hello! I’m Shamma Tabassum, a Content Developer and Graphic Designer currently working at Softeko. I hold a degree in Architecture from RUET. Throughout my academic journey, I’ve come to view design as a collaborative process rather than something that materializes out of thin air.
Over time, I’ve honed my ability to effectively communicate specific ideas to viewers through my designs and graphical illustrations. I’m always eager to exceed expectations and find innovative ways to present mathematical solutions through out-of-the-ordinary presentations and design.

